Examples of CIESIN GIS Support for Columbia University Faculty and Researchers
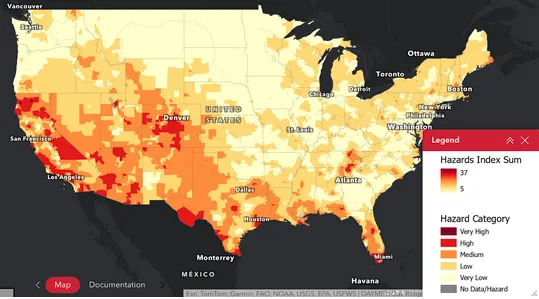
Project: U.S. Natural Hazards Index
Client: National Center for Disaster Preparedness
The hazard index identifies risks in the U.S. for fourteen hazard types at the local level (census tracts), along with a composite risk index that incorporates all of the hazards. CIESIN performed the aggregations for the “big data” hazards layers in the collection, aggregating 40 years of hourly climate data at 1km spatial resolution to construct both a heat and cold index measure, as well as aggregating the 1 foot horizontal resolution NOAA Sea Level Rise data.
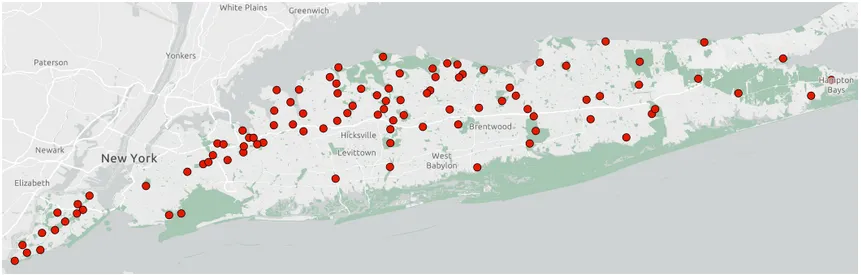
Project: Population Exposure to Tick-borne Diseases
Client: Ecology, Evolution, and Environmental Biology
Changing ecology and human recreational activities impact the prevalence of tick-borne illnesses in the Northeast. In this study, CIESIN assisted Columbia’s Eco-Epidemiology Lab in designing a spatially representative household survey in portions of New York and Massachusetts to gauge human exposure to ticks based on nearby sampling sites.
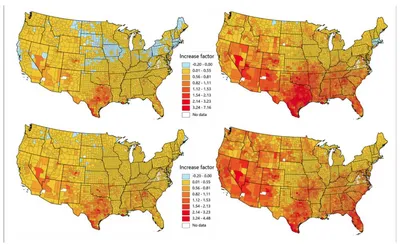
Project: Solar-Powered Desalination Potential in the United States
Client: School for Engineering and Applied Sciences, with funding from the Department of Energy
Water demand in the U.S. is forecast to increase 40% by 2050 and 220% by 2070, which will lead to water deficits in the future. Simulations of desalination operations in different regions of the U.S. were performed to estimate the water that could be produced. CIESIN performed the underlying spatial data analysis.