|
|
CIESIN Welcomes New Associate Director for Science Applications
|
|
October 20, 2023
CIESIN is pleased to announce the arrival of Dr. Dana Thomson, a prominent public health and spatial data expert who has worked at the intersection of demography, public health, and geography for two decades. Dr. Thomson’s work is characterized by open data, user-centered design, equitable partnerships that address historical inequities, and co-design of meaningful information. She will manage the CIESIN Science Applications division, which advances interdisciplinary research and applications on human-environment interactions, bringing to bear state-of-the-art scientific data and knowledge on pressing sustainable development challenges. Dr. Thomson helped to establish the Integrated Deprived Area Mapping System (IDEAMAPS) Network which brings together experts from traditionally-siloed “slum” mapping communities including community members, government officials, humanitarians, and data scientists. Several projects within the IDEAMAPS Network are building the infrastructure and processes necessary for “slum” residents and local experts to access the data they need in appropriate formats and validate modelled outputs (maps) in areas they are familiar with, and for modelers to access a validation data layer to improve future iterations of models. Dana is also a pioneer in the field of gridded population sampling, developing innovative tools and sampling approaches to more accurately measure populations in data-scarce settings, especially vulnerable and mobile populations who are poorly captured by traditional data collection methods. She developed GridSample.org and other tools that help survey experts without Geographic Information System (GIS) skills to create sample frames from gridded population data, and recently published the go-to manual on Designing and Implementing Gridded Population Surveys. Dana holds a BA in Geography from the George Washington University, an MSc in Global Public Health from the Harvard School of Public Health, and an MSc and PhD in Social Statistics from the University of Southampton (UK). Her research has evaluated the accuracy of gridded population estimates and feasibility of their use for fieldwork in lower- and middle-income countries, and includes several large-scale evaluations of health systems in Africa, Asia, and the Caribbean using geospatial and household survey data. She has also taught practitioners and applied researchers at Harvard University, the University of Rwanda, and the University of Southampton, and worked with AmeriCorps, the Brookings Institution, Johns Snow Inc., the Measure DHS Project, and the World Bank. She has published 48 peer-reviewed articles in journals such as Land Use Policy, PLoS One, Urban Science and the International Journal of Health Geography.
|
|
New Mapper for New York State Expands Access to Flood Planning
|
|
July 7, 2023
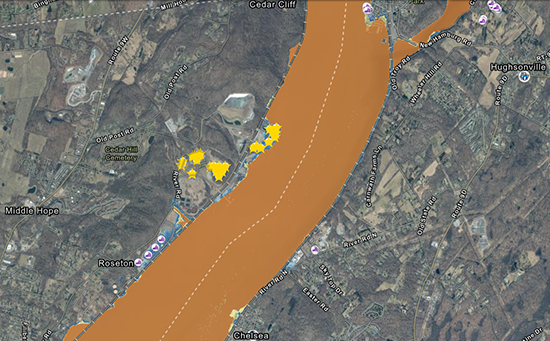
An easy-to-use mapping tool increases flood planning capacity in New York State, especially for historically underrepresented communities, and can enhance planning for sea level rise. Developed by the NASA Socioeconomic Data and Applications Center (SEDAC) at Columbia Climate School’s CIESIN, the New York State Flood Impact Support System Application (NYS FIDSS) visualizes building footprint data for nearly all New York State’s infrastructure, except New York City. It is highly interactive and accessible, requiring only Internet access, ensuring that communities with fewer resources can create comprehensive flood scenarios for planning, response, and policymaking. The easy interface of the NYS FIDSS mapper aligns with the aims of the new NASA Open Science initiative to more openly share software, data, and knowledge to advance inclusiveness and improve social justice. The Mapper includes a data set, U.S. Social Vulnerability Index Grids, developed by the NASA SEDAC and based on the Centers for Disease Control’s Social Vulnerability Index, which lets users visualize relative “social vulnerability” for areas impacted by flooding. The index displays fine-grained information on social conditions of the population in a particular area, including economic level, who is in the household, minority status, dwelling places, the ability to understand English, and access to transport. This information can be critical to targeting flood planning resources and aid to the areas that most need it—before, during, or after a flood event. The NYS FIDSS mapper is based on results from the project New York State Building Footprints with Flood Analysis, which provides infrastructure data for all New York State counties excluding New York City. It also includes data on areas bordering the lower Hudson River Valley and Westchester's Long Island Sound shoreline, from the Hudson River Flood Impact Decision Support System, a flood assessment mapping tool developed by CIESIN under support from NYSERDA. The mapper also provides infrastructure, flooding, and socioeconomic data layers at the local level from the Consortium for Climate Risk in the Urban Northeast (CCRUN), whose members from academia, including CIESIN, conducted stakeholder-driven research to reduce climate vulnerability in the urban northeastern United States, supported by NOAA. The lead developers are CIESIN senior research staff assistant Juan Martinez and senior systems analyst/GIS developer Kytt MacManus.
See: The New York State Flood Impact Support System Application (NYS FIDSS) Mapping Tool
|
|
User Working Group Convenes around New Strategic Plan
|
|
June 1, 2023
The NASA Socioeconomic Data and Applications Center (SEDAC) held its annual User Working Group (UWG) meeting May 30‒31 at the Manhattanville campus of Columbia University. UWG chair William Easterling and five other members attended in person, and other members participated remotely. Additional participants included Nancy Searby, program manager for the NASA Earth Science Applied Sciences Capacity Building Program; Cerese Albers and Joel Scott from NASA Headquarters; NASA Distributed Active Archive Centers (DAACs) engineers Frank Lindsay, Sandra Blevins, Sara Lubkin, and Nathan James; Tammy Walker of the Oak Ridge National Laboratory DAAC; and Wade Albright of the Alaska SAR Facility (ASF). The UWG reviewed the final draft of the updated SEDAC Strategic Plan, reviewed new impact metrics developed by SEDAC, and approved a range of new data sets, pending receipt of final comments. The meeting included a panel discussion of NASA’s efforts related to environmental and climate justice, moderated by SEDAC manager Robert Chen with panelists Albers, Easterling, Searby, and UWG member Catherine Nakalembe. SEDAC deputy manager Alex de Sherbinin, systems engineer Sri Vinay, project scientist Susana Adamo, systems programmer Kytt MacManus, and other SEDAC staff presented and participated in the meeting.
See: NASA SEDAC User Working Group
|
|
A New Report Posits Potential Mobility in Africa from Climate Impacts
|
|
February 7, 2023
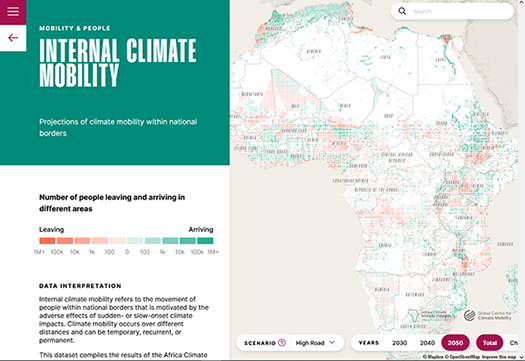
A new report from the Africa Climate Mobility Initiative (ACMI), African Shifts: Addressing Climate-Forced Migration depicts African people’s experience of climate vulnerability and presents possible scenarios for movements due to climate impacts on the continent between now and 2050. Finally, it presents eight key recommendations to be implemented between now and 2030 that focus on constructive, adaptive responses to climate mobility, in alignment with the 2030 Sustainable Development Goals and the Paris Agreement. CIESIN contributed to the report by producing spatially explicit projections of both internal and international mobility that may occur from climate impacts, within and among African countries, up to the year 2050. This modelling builds on the innovative approaches of the World Bank’s Groundswell series of reports, for which CIESIN worked with City University of New York and the Potsdam Institute for Climate Impact Research on the modeling. The modeling work was complemented with findings from field research conducted by the Mixed Migration Centre. The ACMI is a joint undertaking between the African Union Commission, the United Nations Development Programme (UNDP), the UN Framework Convention on Climate Change (UNFCCC), the International Organization for Migration (IOM), and the World Bank. The CIESIN team was led by Alex de Sherbinin, deputy director and senior research scientist, and included Fabien Cottier, postdoctoral research scientist; Susana Adamo, research scientist; Briar Mills, former geographic information specialist; Greg Yetman, associate director for Geospatial Applications; Tricia Chai-Onn, senior geographic information specialist; and John Squires, geographic information specialist.
See: Report (19 MB PDF)
Interactive Web site, “Voices from the Frontlines″
|
|
New SEDAC Data Releases Include First-Ever Global Poverty Grid
|
|
January 4, 2023
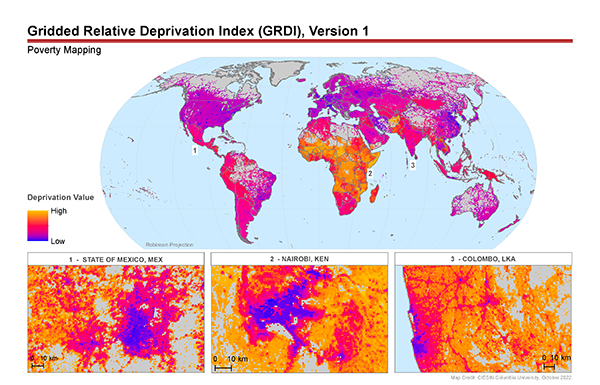
Several new data products have been released under CIESIN’s NASA-funded Socioeconomic Data and Applications Center (SEDAC). Foremost among them, the Global Gridded Relative Deprivation Index (GRDI) measures relative poverty and deprivation using subnational data on human development, infant mortality, and child dependency, as well as satellite-derived data on built-up areas, nighttime lights, and change in nighttime lights. It is the first product of its kind that covers the entire world at a 1 kilometer spatial resolution. Other new data sets from the NASA SEDAC include: —Daily and Annual Air Quality Data Sets for the Contiguous U.S. support research in environmental epidemiology, environmental justice, and health equity by linking with ZIP Code-level demographic and medical data sets. —Country Trends in Major Air Pollutants, a framework of public-health-focused air quality indicators that measures more than 200 countries' trends in exposure to particulate matter (PM2.5), ozone (O3), nitrogen oxides (NOx), sulfur dioxide (SO2), carbon monoxide (CO), and volatile organic compounds (VOCs). Developed by an interdisciplinary team from Yale University with NASA SEDAC. —Urban and Land Backscatter Time Series. Based on satellite microwave backscatter, the data set traces trends in urban settlements from 1993 to 2020. Developed by a team led by Steve Frolking, University of New Hampshire. —Twentieth Century Crop Statistics, a crop yield data set spanning the period 1900‒2017 provides national and subnational data on production, yield, and harvested area of maize and wheat for many of the world’s major bread baskets. Developed by W. Anderson and others. —Water Security Monthly Grids. Monthly surpluses and deficits of freshwater, computed on a 0.25 degree grid for 1948‒2014. Developed with ISciences.
See: Global Gridded Relative Deprivation Index (GRDI), v1 (2010 – 2020)
Daily and Annual PM2.5, O3, and NO2 Concentrations at ZIP Codes for the Contiguous U.S., v1 (2000 – 2016)
Country Trends in Major Air Pollutants v1 (2003 – 2018)
Global Monthly and Seasonal Urban and Land Backscatter Time Series v1 (1993 – 2020)
Twentieth Century Crop Statistics, v1 (1900 – 2017)
Water Security (WSIM-GLDAS) Monthly Grids, v1 (1948 – 2014)
|
|